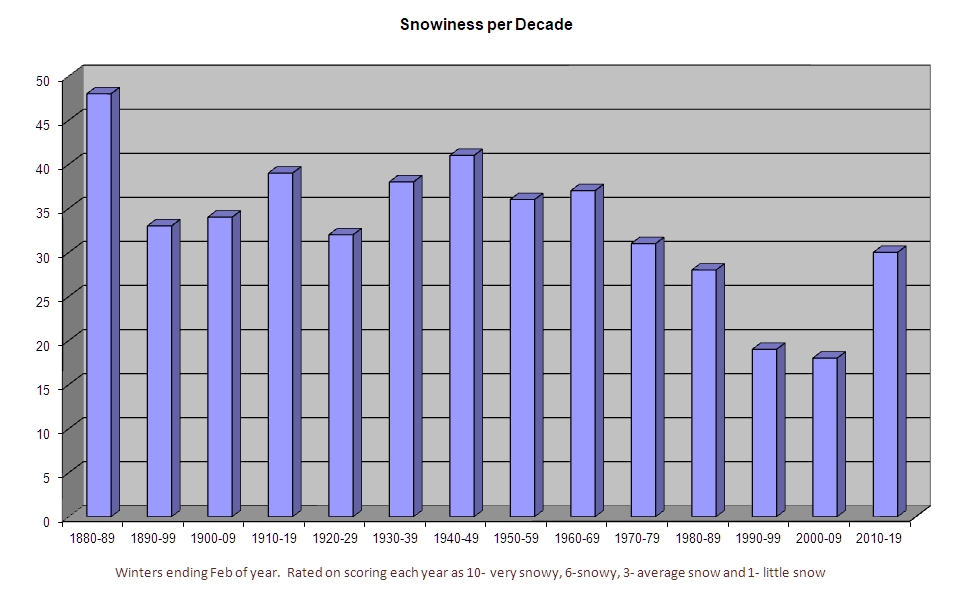
This graph is a representation of how snowy each decade was. It is compiled from original data by Leo Bonacina and augmented by Dave O'Hara at Durham UK Weather Station . In the original work each year was assigned a designation of "little", "average", "snowy" or "very snowy" according to subjective assesments depending on the amount of snow and how generally it fell.
What I have done is taken each decade starting with winter 1879/80 and attributed an arbitary weighted points system to each year to give a decade score as follows:-
Nevertheless I find the results interesting and as such it shows that this winter (2008-2009) needs to be classified as at least "snowy" to prevent it from being the least snowy decade for over a hundred years and probably longer. I will let you draw your own conclusions why this might be.
Dave Cornwell, January 2009